

Download Integrated Plan as PDF
Executive Summary
Overview
Laney College, located in downtown Oakland, is a diverse, urban community college committed to equity and student success.
In Fall 2017, Laney College convened an Integrated Planning Working Group including representatives from the Foundation Skills Committee, SSSP Committee, Student Equity Committee, Strong Workforce, Academic Senate, administrators, faculty, staff, and students to develop a framework for Laney’s Integrated Plan. The Working Group developed high-level goals for the college that integrated the three funding streams with a focus on student success and equity. The plan was developed over the fall semester, with additional input from various committees and shared governance groups.
2017-2019 Integrated Goals
Through a collaborative process, Laney College developed the following integrated goals:
- Increase access to the college for disproportionately impacted populations
- Increase basic skills completion, including the number of students successfully transitioning to college-level mathematics and English courses.
- Close achievement gaps for disproportionately impacted groups.
- Improve success rates in degree attainment, certificate attainment, and transfer.
- Increase student course completion and retention rates
- Provide professional development for faculty and staff to support student success and equity
Laney is currently developing a new 5-year Strategic Plan, and will continue an ongoing process of reflection and assessment of these goals in its development.
Student Equity Goals
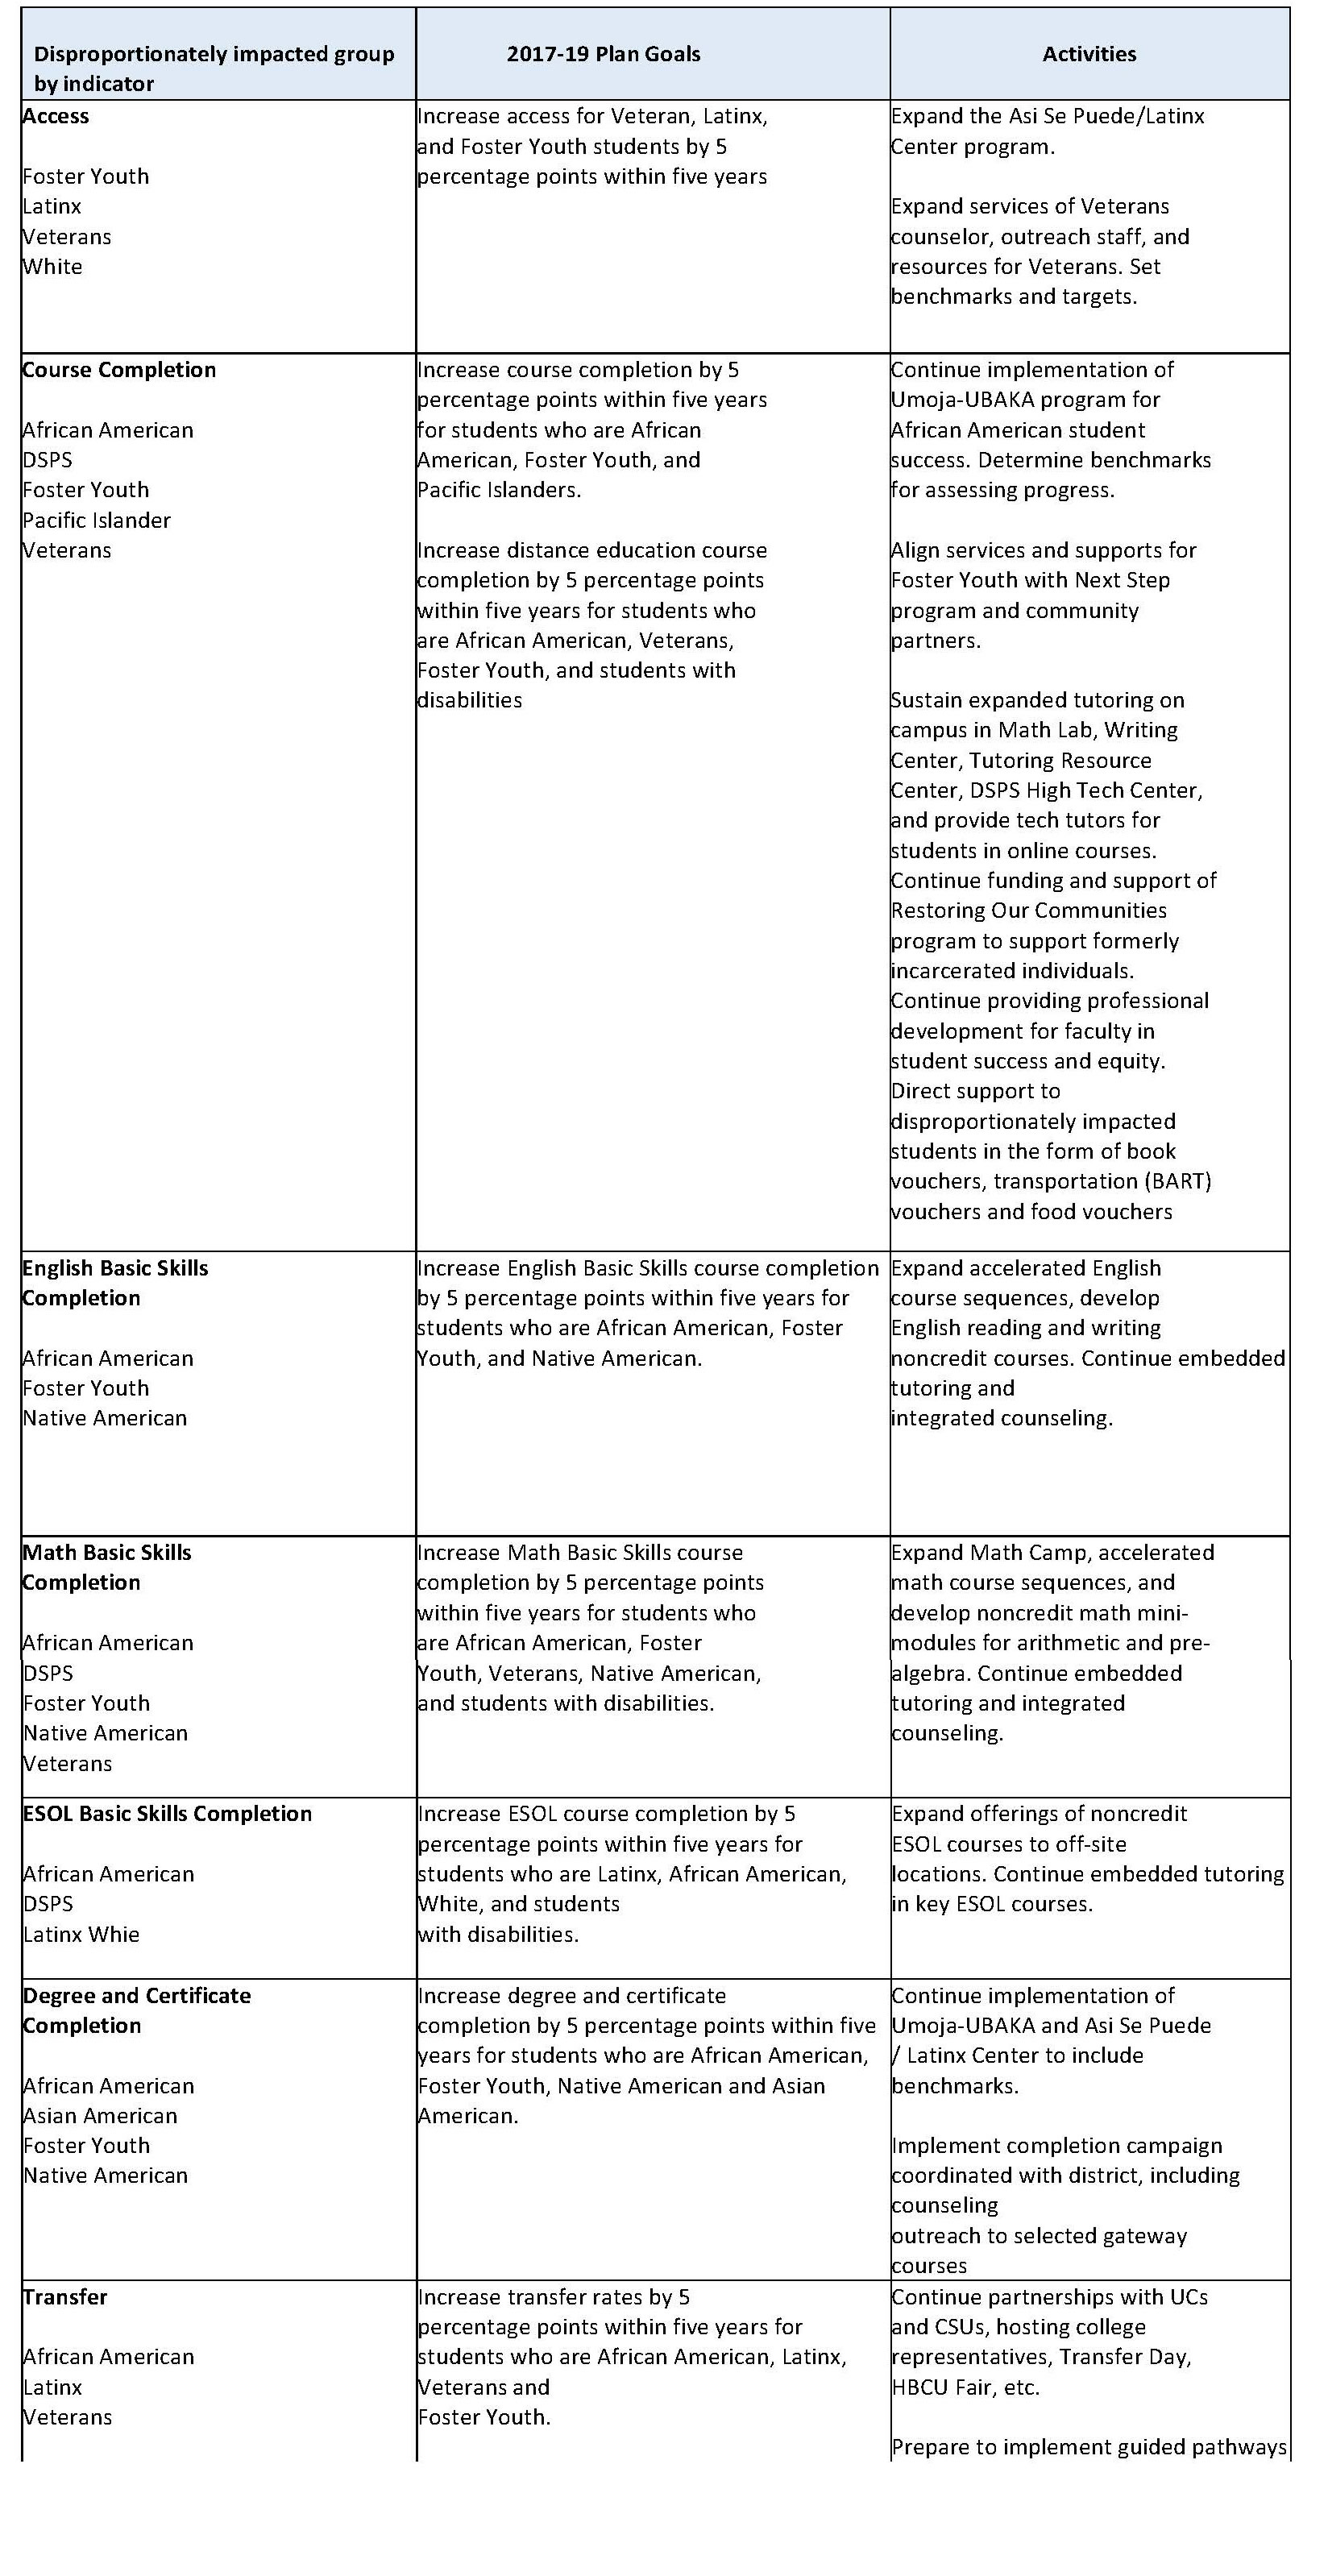
The chart below highlights the Student Equity goals for each disproportionately student group, and the activities that Laney College will undertake to achieve these goals and the resources budgeted for these activities. Laney’s 2015-16 Student Equity Plan, our disproportionate impact study was conducted using the proportionality index to analyze state Chancellor’s office data.
Our Student Equity Committee sought data that reflected a deeper diversity of our student population—including subgroup analysis such as Southeast Asian, Arab American, and LBGTQ that we hoped we could achieve by analyzing local data.
For this 2017-19 Integrated Plan, we used local data from 2013-15 to set a new benchmark against which we can measure our progress.
Resources budgeted for Student Equity activities for 2017-18:
The following chart represents the resources budgeted for Student Equity activities in 2017-18.
| Object Code/Description | Total Budget |
| 1000s Academic Salaries | 111,299 |
| 2000 Classified, Nonacademic Salaries | 231,276 |
| 3000 Employee Benefits | 68,493 |
| 4000 Supplies and Materials | 6,538 |
| 5000 Other operating expenses and services | 151,810 |
| Total | 728,697 |
Summary of Progress made on Student Equity Goals:
Since 2014, Laney has made some significant progress on its Student Equity Goals.
For course completion, disproportionate impact measured by the proportionality index with a
0.85 threshold indicated no disproportionate impact for any subgroups, with the exception of Native American students(as shown in the table B1-2), which would require only a total of 6 course successes to close the gap (as shown in table B1-3).
Table B1-2. Proportionality Index for Success Rates (Fall Term) by Race/Ethnicity
| Race/Ethnicity | 2010 | 2011 | 2012 | 2013 | 2014 | 2015 | 2016 |
| African- American | 0.794 | 0.830 | 0.831 | 0.832 | 0.836 | 0.847 | 0.863 |
| American Indian/Alaskan | |||||||
| Native | 0.827 | 0.779 | 0.731 | 0.802 | 0.930 | 0.942 | 0.801 |
| Asian | 1.163 | 1.163 | 1.130 | 1.171 | 1.166 | 1.140 | 1.141 |
| Hispanic | 0.966 | 0.973 | 0.980 | 0.965 | 0.959 | 0.974 | 0.918 |
| Multi-Ethnicity | 0.830 | 0.895 | 0.922 | 0.915 | 0.979 | 0.909 | 0.910 |
| Pacific Islander | 0.844 | 1.057 | 0.952 | 0.841 | 0.974 | 0.942 | 1.057 |
| Unknown | 1.084 | 1.032 | 1.068 | 1.060 | 0.991 | 1.040 | 1.018 |
| White Non- Hispanic | 1.114 | 1.113 | 1.098 | 1.091 | 1.101 | 1.084 | 1.086 |
Table B1-3. Closing the Gap: Number o Changes in Course Outcomes to Reach Proportionality Threshold Among Race/Ethnicity in Course Success Rates (Fall Terms
| Race/Ethnicity | 2010 | 2011 | 2012 | 2013 | 2014 | 2015 | 2016 |
| African- American | 910 | 328 | 283 | 267 | 183 | 49 | 0 |
| American Indian/Alaskan | |||||||
| Native | 7 | 14 | 16 | 6 | 0 | 0 | 6 |
| Asian | 0 | 0 | 0 | 0 | 0 | 0 | 0 |
| Hispanic | 0 | 0 | 0 | 0 | 0 | 0 | 0 |
| Multi-Ethnicity | 25 | 0 | 0 | 0 | 0 | 0 | 0 |
| Pacific Islander | 3 | 0 | 0 | 4 | 0 | 0 | 0 |
| Unknown | 0 | 0 | 0 | 0 | 0 | 0 | 0 |
| White Non-Hispanic | 0 | 0 | 0 | 0 | 0 | 0 | 0 |
Prior year expenditures for Student Equity are summarized below:
Laney Student Equity 2015-16 Expenditures
|
Laney Student Equity 2016-17 Expenditures (including carryover from 2015-16)
| Object Code/ Description | Total Budget |
| 1000 Academic Salaries | 336,117 |
| 2000 Classified, Nonacademic Salaries | 123,523 |
| 3000 Employee Benefits | 90,080 |
| 4000 Supplies and Materials | 52,737 |
| 5000 Other operating expenses and services | 351,629 |
| 6000 Capital Outlay | 87,300 |
| 7000 Other Outgo | 170,996 |
| Total | $1,212,382 |